The Arkturus Process Visualisation functionality, also known as ProViz, is an invaluable tool for the discovery component of an improvement process. ProViz allows the process data to be visualised quickly and accurately and identify what is working well and what is not, such as bottlenecks and rework loops.
Data from your systems is taken through our algorithms and displayed in our temporal event-based model, and we form a visualisation of your business processes.
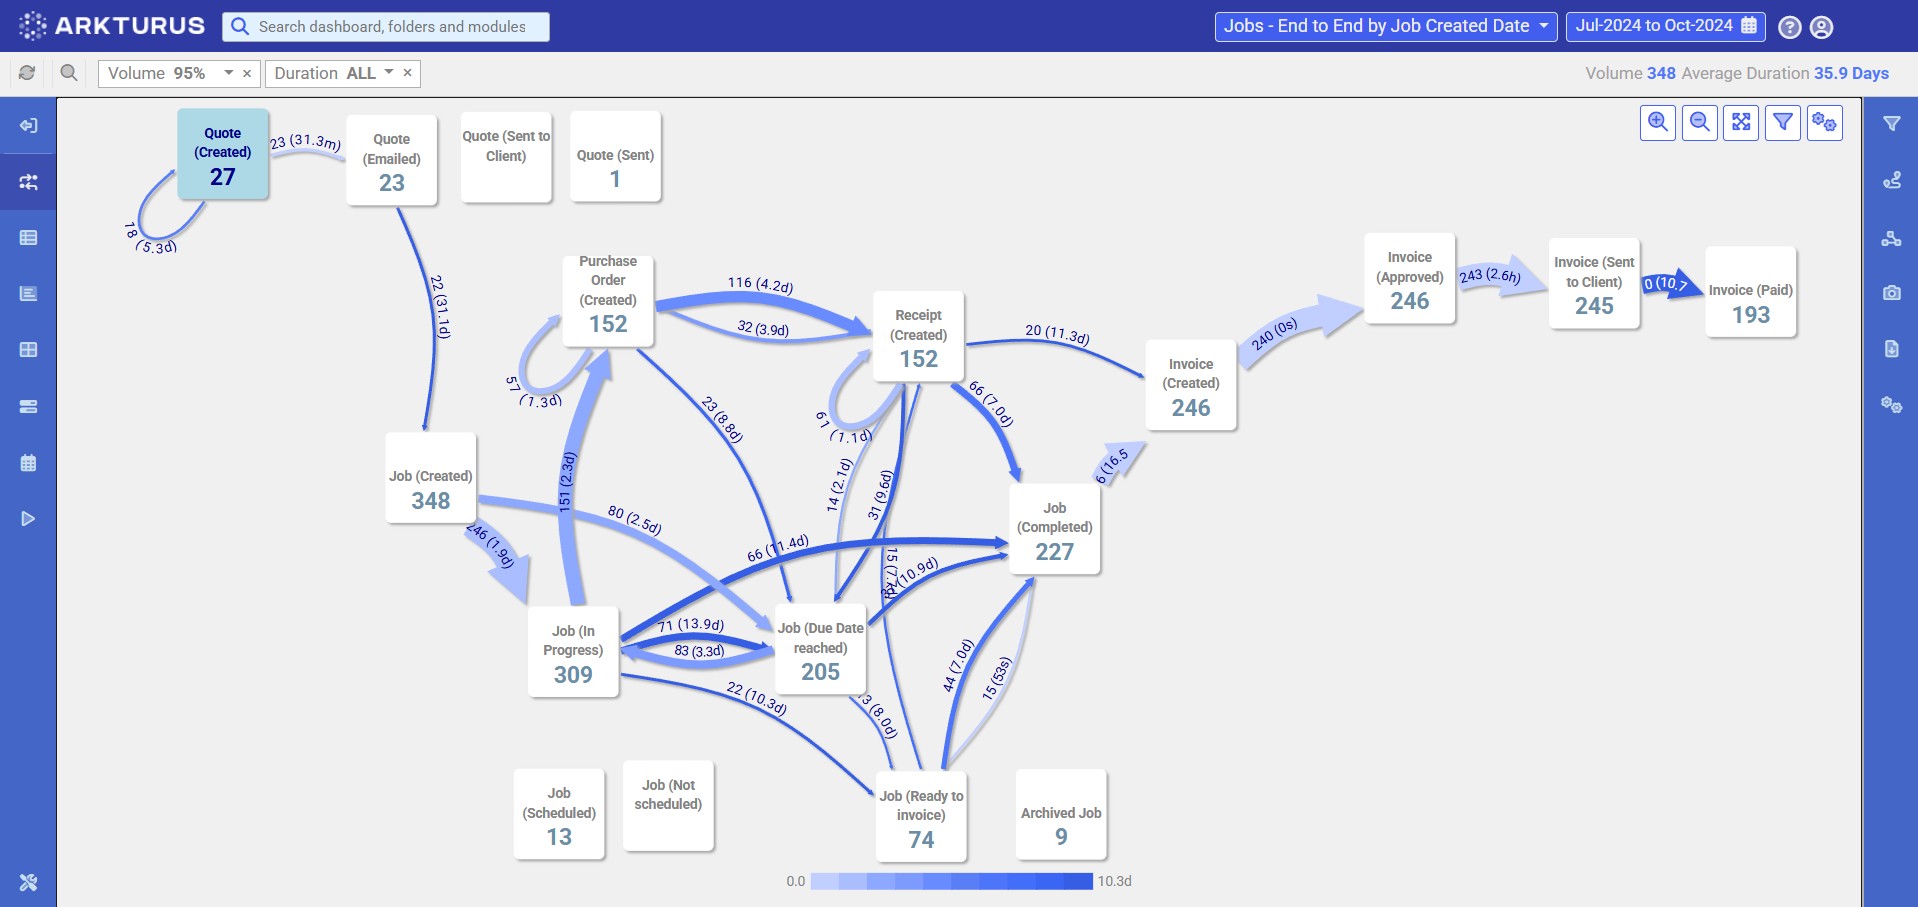
From the top menu bar, navigate between different processes in your organisation, available views and the dates of interest.

The processes are presented in our Proviz module as Nodes and Links. The Nodes represent the activities in your process and the Links represent the transitions between the activities. Every node and link has a number associated with it - it describes the number of cases passing through it. The thickness and colour of the links are determined by the volume of cases and the duration.

Depending on the area of focus, there may be a need to filter Proviz to present data that has or hasn't gone through a certain activity. This can be achieved by applying a node inclusion or exclusion rule on Proviz.
To apply a node inclusion filter, select the Node of interest and click the + button. The applied filter will show only the data that has completed the selected activity. Alternatively, you can exclude a node by clicking on the ≠ button. This will only show the data that has not completed the selected activity.
The filters applied can be seen in the grey filter bar at the top of the Process Map.
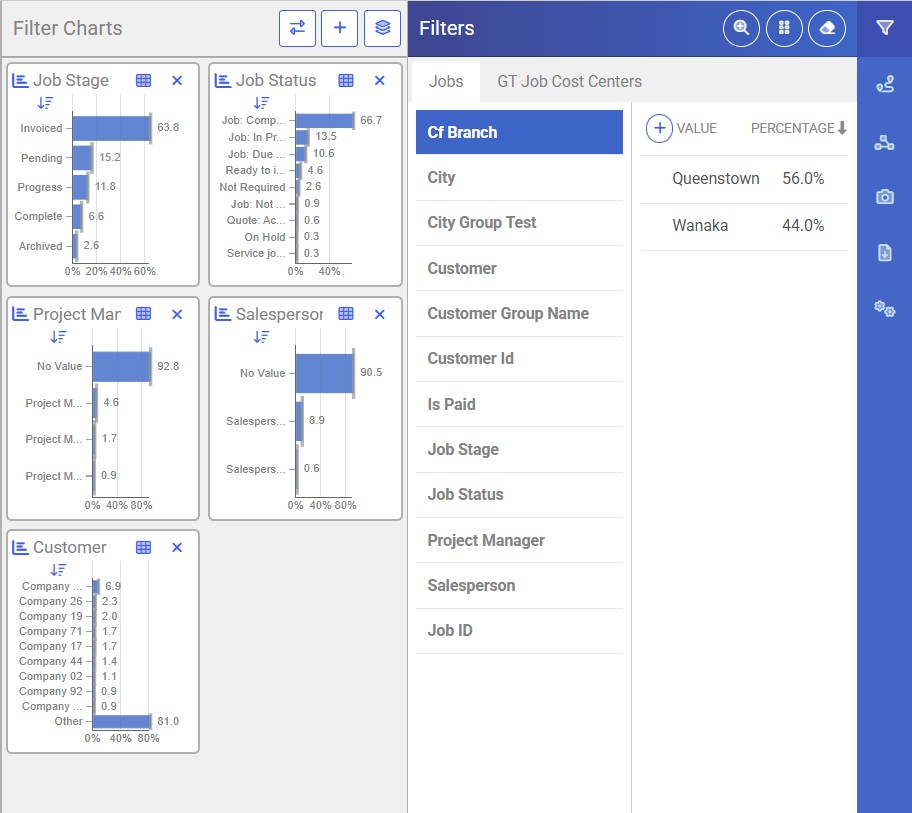
Within the Proviz page, Filters Charts can be displayed. Here it shows you the distribution of the requests to different dimensions available to your data. For example, it can show the distribution of requests with customer types, region and salesperson
You can expand and collapse the Filter Charts by the arrow button.
Filtering is a useful tool in Proviz, allowing users to filter the processes based on your defined criteria, making it easier to focus on specific information.
Using Filter Charts, you can select one or multiple filters to narrow down to a subset. For example, you want to look at field services requests for houses in the Auckland Region. From the filter charts, you can select and narrow down to Houses Site Type and Auckland Region by clicking on the filter chart bars.
Like filtering via Nodes, the applied filters can be seen in the grey filter bar at the top of the process map.
Another method to apply the filters is via the Filter settings on the right blue menu bar.
Applied filters can be cleared by clicking on the Reset button in the grey filter bar.