Dashboards are useful for communicating insights and for operational and management reporting of standard or user-defined measures. It allows the business to display the data and summarise these events with easy-to-understand visuals. Depending on the audience, the dashboards can be used to display key business matrices such as daily operations data, strategic key performance indicators (KPIs) and analytical charts for monitoring trends.
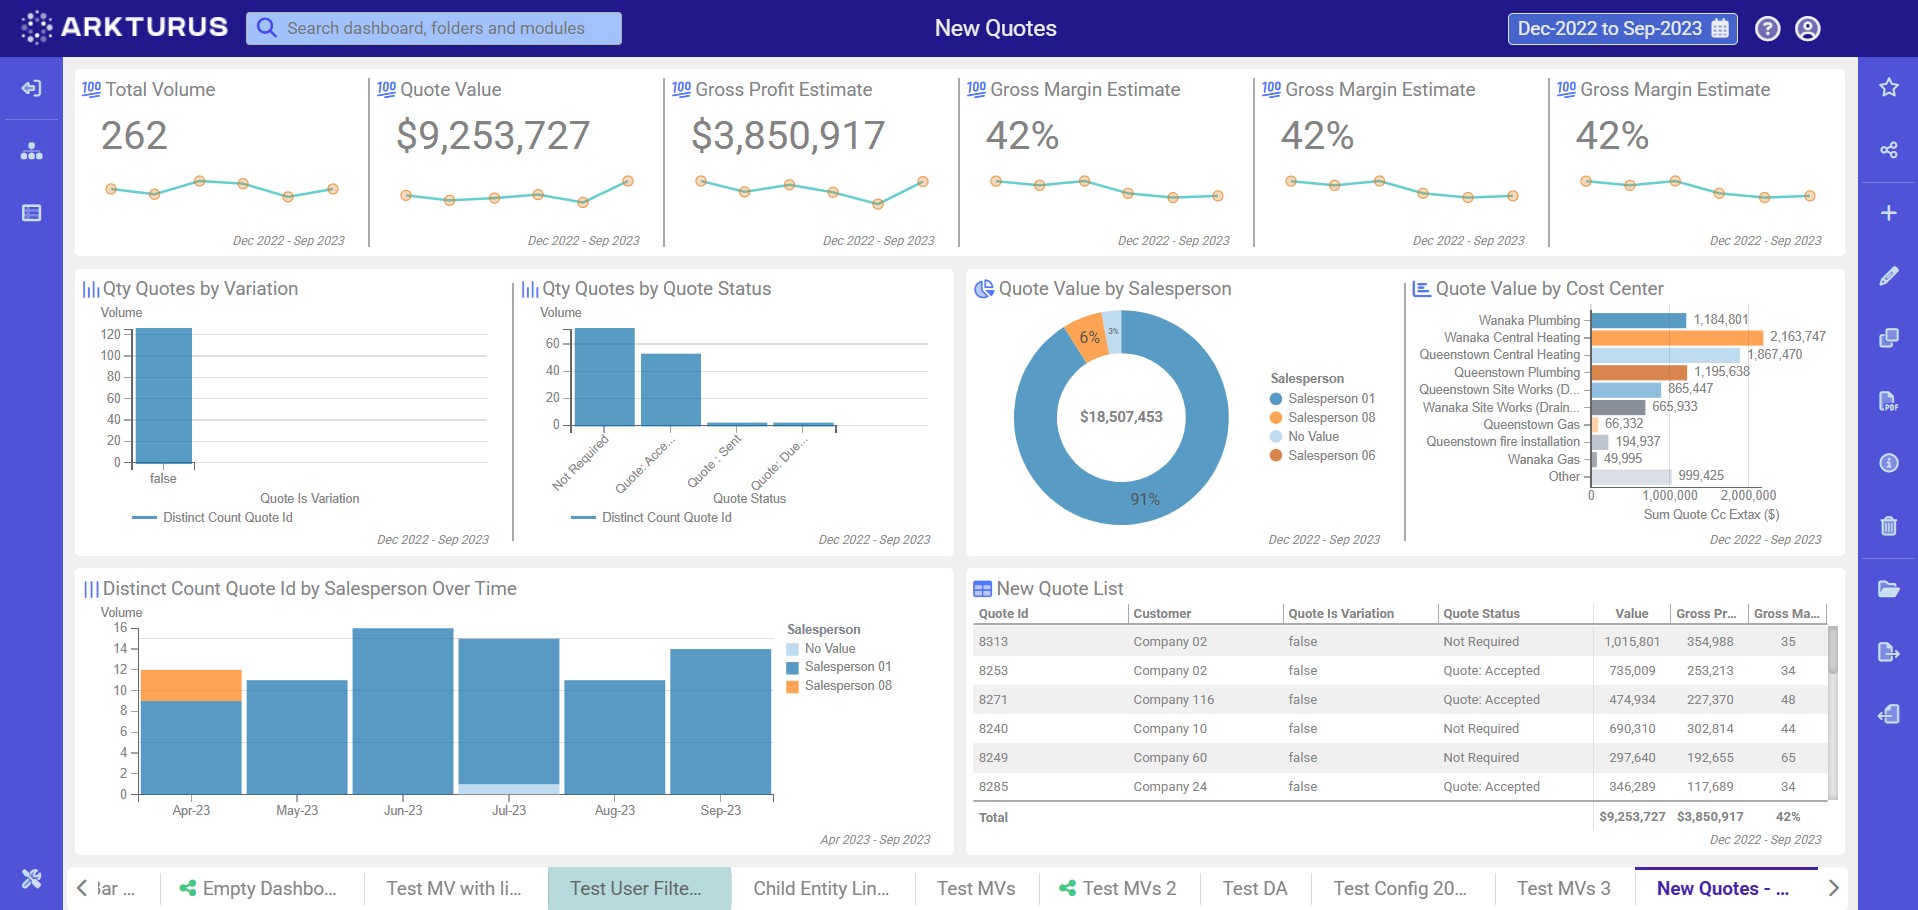
Interactive chart filtering creates a dynamic experience. Rather than providing a static number/chart summary, interactive chart filtering allows the user to be agile and interact with the chart and see changes as well as allow you to drill down on areas of interest with just a few clicks.

Easily use the dashboard to do multi-layer filtering and then click throughto Proviz to visualise the process of the filtered data.
To enable multi-filtering, open the dashboard's Configuration Settings and ensure Support Multi-level Filtering is checked.