Introduction to Compare Graphs
Compare Graphs is an excellent feature for side by side comparison when looking at different scenarios.
Compare Graphs Overview
The ability to do visual comparisons between different parameters can allow users to identify similarities and differences and there are different ways this feature can be utilised.
Example Use Cases:
- Compare the flow of work between a good-performance branch with an under-performing branch to visualise and spot the differences.
- Analyse the process before and after a change initiative to see how the change has impacted the process.
Adding Filters for Comparison
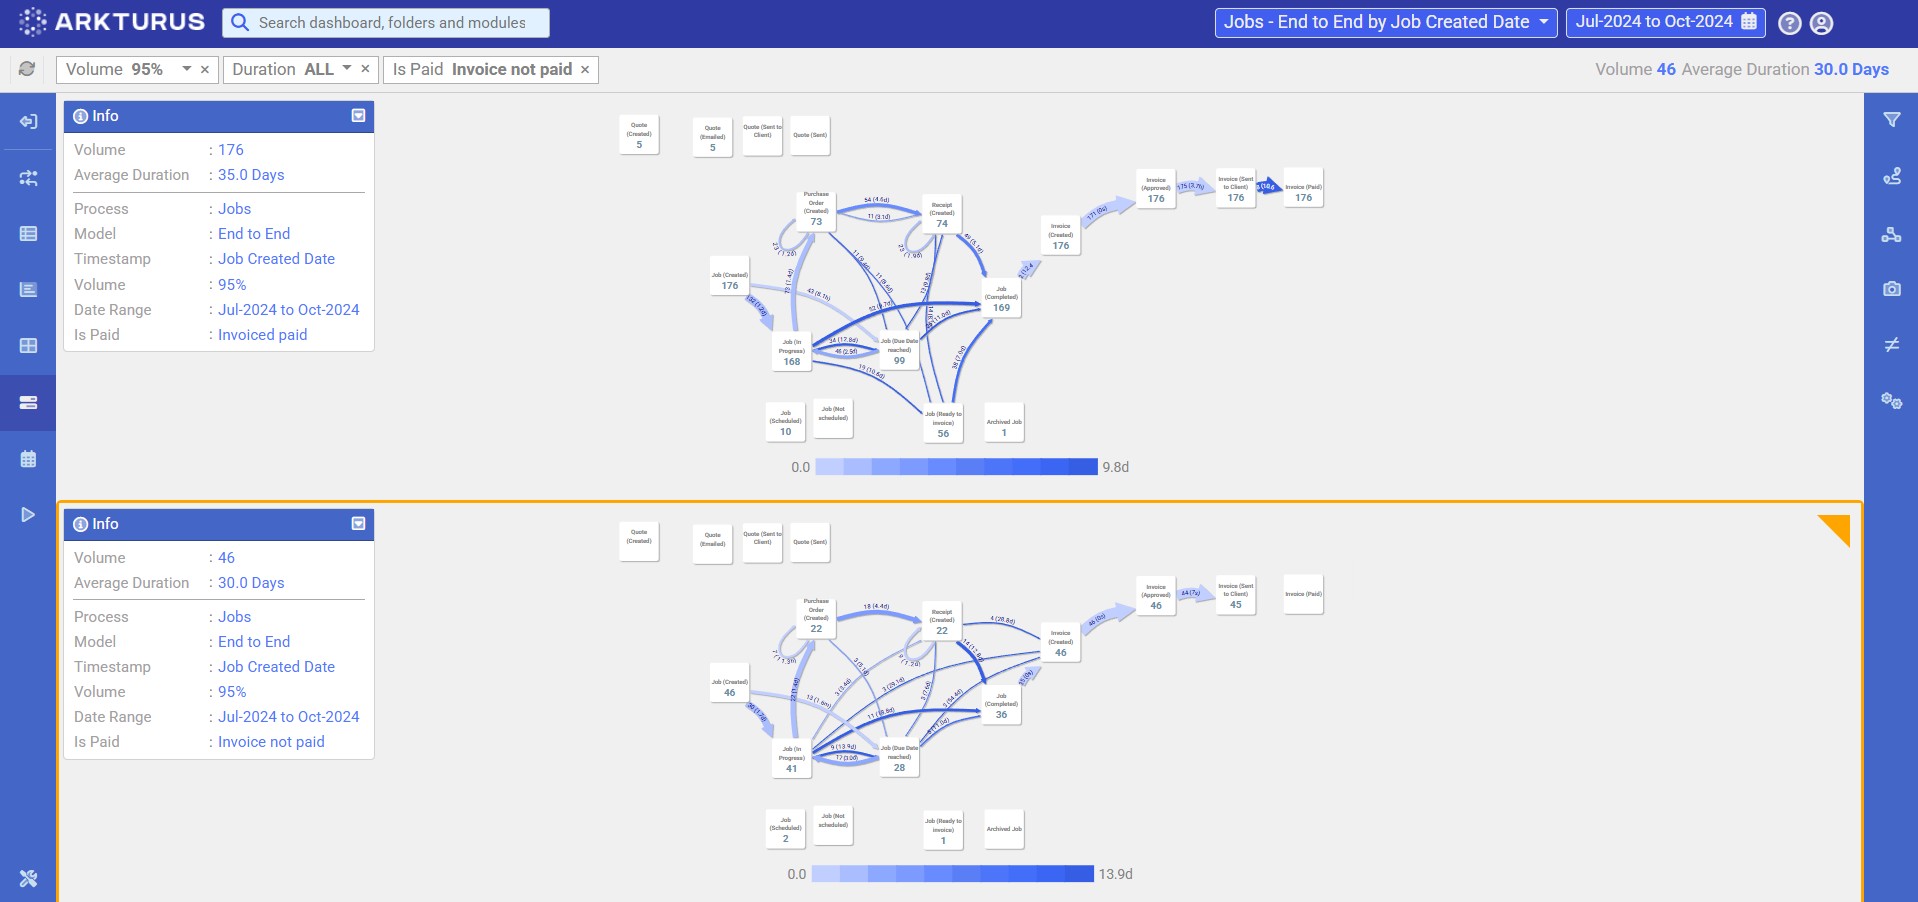
Upon opening Compare Graphs, you will notice that the two processes are identical.
To apply a filter to a process:
- Select the graph which you want the filter to be applied to. This is identified by the yellow frame and triangle on the top right corner.
- Apply the parameter change. This could be selecting a different date period via the Date Dropdown, or using Filters to select a dimension.
- Repeat the steps to the other process to select a different date/dimension.
The applied filters can be seen in the Info box.