Rework is one of the most expensive and least visible problems in operations. Traditional reporting shows final outcomes, but Process Intelligence exposes how many times a case was touched along the way.

Rework is one of the most expensive problems in any operational process, and one of the least visible. Traditional reporting shows you the final outcome: the case was completed, the appointment was attended, the task was closed. What it rarely shows you is how many times that case was touched along the way, which steps it revisited, and what that cost in time and effort. Process Intelligence changes that.
Every rework event means a task that had to be touched more than once. In isolation, a single rework looks minor. Across hundreds or thousands of tasks, it adds up to significant staff time, delays for patients or customers, and increased risk of error.
The challenge is that rework is largely invisible in traditional reporting. You seethe final outcome, not all the trips a case took to get there. Process Intelligence makes rework visible by reading the actual sequence of events in your system and reconstructing every path a case followed, including the backwards ones.
When you can see rework clearly, something important shifts. You stop having a vague sense that things are taking longer than they should, and start being able to point to where, how often, and for whom.
When a case revisits a step, it has already passed through, Process Intelligence identifies this as a loop and surfaces it visually in the process map as a backward-flowing arc. The thickness of that arc tells you how frequently cases travel that path. Clicking on it opens the analysis.
From there you can see four things:
When you understand where rework is happening and who is affected, you move from suspicion to evidence.
The following walkthrough uses an example from a private radiology network analysed in Arkturus. The process covers the full patient journey from referral creation through to exam completion and report authorisation.
Opening the process map immediately reveals a thick backward arc from the Reschedule node back to earlier steps in the journey. In a month with 7,769 patient arrivals there were 1,099 reschedule events in total, with 167 cases experiencing multiple reschedules. This is not noise in the data. It is a structural pattern, and it is costing the network time every single day.
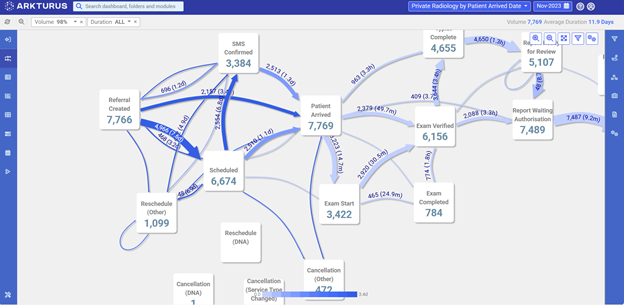
Figure 1: Full process map for Private Radiology (Nov 2023). The thick backward arc at Reschedule (Other) is the rework loop, with 1,099 reschedule events across the month.
“The process map made visible in seconds what we had spent months trying to quantify in spreadsheets.”
Clicking the rework loop filters the entire map to show only the 167 cases that experienced a multiple reschedules in November 2023. The average journey for these cases took 21.8 days. That’s nearly double the overall process average of 11.9 days.
That gap is the cost of rework made concrete. It is not an abstract inefficiency. It is 10 extra days per case with multiple reschedules, across 167 cases in a single month.

Figure 2: Clicking the rework loop isolates the 167 affected cases. Average duration 21.8 days vs. 11.9 days overall — nearly double.
“When we clicked the loop and saw the average duration almost double, that was the moment the room went quiet.”
Opening the attribute panel breaks the 167 rework cases down by dimension — clinic,radiographer, radiologist, receptionist, cancellation reason. Clinic A stands out immediately. It accounts for a disproportionate share of reschedules relative to its overall volume. The rework is not spread evenly across the network.
Filtering by Clinic A then reveals which receptionist is driving the pattern. One staff member accounts for a significantly higher rescheduling rate than colleagues handling similar volumes. This pinpoints exactly where a training or process conversation needs to happen.

Figure3: The attribute panel breaks rework down by clinic, radiographer, radiologist,and reception staff. Clinic A accounts for 44.3% of reschedules.
“We knew there was rework in the process. What surprised us was how unevenly it was distributed —one clinic, one person, was carrying the bulk of it.”
Across organisations and process types, rework analysis consistently surfaces three patterns worth looking for.
Rework is concentrated, not distributed. When you filter by attribute,what looks like a process-wide problem almost always turns out to be concentrated in a specific team, shift, or case type. That changes where you focus your effort entirely.
The same step keeps triggering the loop. If cases consistently return to the same step, that is where the work is needed. Whether it is a quality check with unclear criteria, an approval that lacks context, or a handover that routinely creates confusion.
Rework adds more time than the original step. The delay introduced by a rework event is often greater than the original step’s processing time. Quantifying this makes the case for improvement far easier to communicate to leadership.
Investigating rework in Arkturus requires no query building or data preparation. The steps are straightforward:
Athena’s Tips for Getting Value from Rework Analysis